Visitor Management Analytics and Reporting


Table of Content
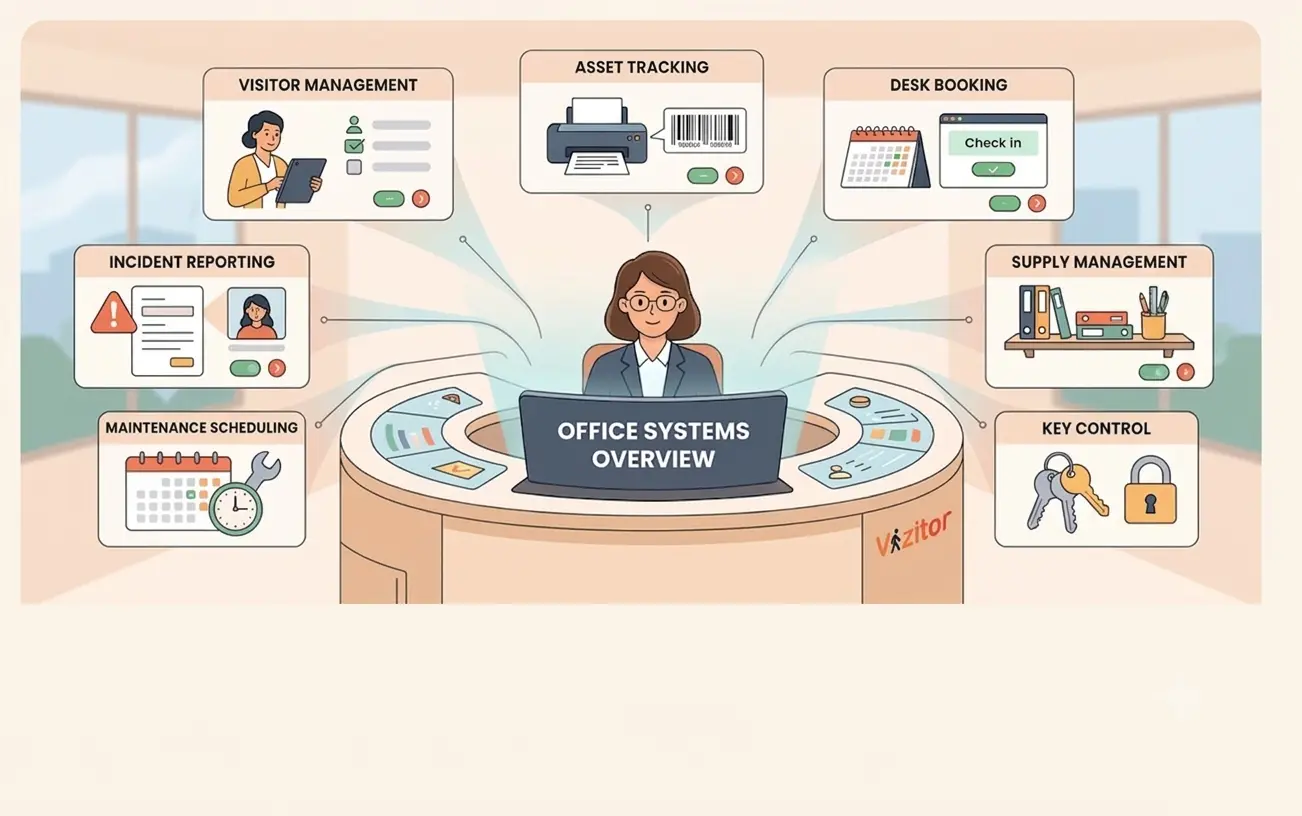
Try Vizitor for Free!
Most organizations install a visitor management system for security and compliance. They get those benefits immediately. But the most valuable long-term asset of digital visitor management is something many organizations overlook: data. Every check-in, every badge printed, every host notification, and every check-out generates structured data that, when analyzed properly, reveals patterns about how your facility operates, who uses it, and where you can improve.
Definition: Visitor management analytics is the practice of collecting, analyzing, and visualizing data from visitor check-in systems to understand visitor traffic patterns, measure operational performance, ensure compliance with regulations, and inform business decisions about facility management, staffing, security, and space utilization.
According to a Verdantix research report, organizations that use workplace analytics tools to inform facility management decisions report an average of 15% improvement in space utilization and 12% reduction in operational costs. Visitor data is a critical piece of this analytics puzzle, and most organizations are sitting on it without using it.
A visitor management system that includes robust analytics and reporting capabilities does more than track who enters your building. It tells you when your facility is busiest, which departments receive the most visitors, how long visitors stay, whether your check-in process is creating bottlenecks, and whether you are meeting your compliance obligations.
This guide explains the key metrics you should track, the dashboard features that make analytics actionable, how to use visitor data for compliance reporting, and strategies for turning insights into decisions.
Why Visitor Management Analytics Matter
Beyond Security: The Strategic Value of Visitor Data
Security is the primary driver for implementing a visitor management system, but the data it generates has strategic value far beyond access control. Visitor management analytics answer questions that facility managers, HR leaders, security directors, and executives ask every day.
How many people are actually in our building on a typical Wednesday? Do we need a second reception desk for peak hours? Which departments attract the most external visitors? Are our meeting rooms sized appropriately for the visitor meetings they host? Is our check-in process fast enough?
From Guesswork to Evidence
Before digital visitor management, these questions were answered with estimates and anecdotes. Visitor management analytics replace guesswork with evidence. Decisions about reception staffing, lobby design, security coverage, and building capacity are no longer based on “it feels like we are busier on Tuesdays” but on verified data showing that Tuesday visitor volume is 38% higher than the weekly average.
Compliance Documentation
Regulatory audits require documentation. How many visitors entered the facility during the audit period? Were all visitors screened? Were all required documents signed? Were visitors properly checked out? Visitor management analytics generate these reports automatically, reducing audit preparation from days to minutes.
10 Key Visitor Metrics to Track
1. Daily Visitor Volume
The most basic metric: how many visitors check in each day. Track this over time to identify trends, seasonality, and the impact of events or organizational changes.
2. Peak Hours
When does visitor traffic peak? Visitor management analytics reveal the busiest hours, which directly informs reception staffing, security coverage, and lobby configuration decisions.
3. Average Check-In Time
How long does the check-in process take from the visitor’s perspective? This metric identifies bottlenecks and measures the impact of process improvements. A well-optimized system should achieve average check-in times under 60 seconds.
4. Visitor Type Distribution
What percentage of visitors are clients, vendors, candidates, delivery personnel, or personal guests? This distribution helps allocate resources and tailor the check-in experience for your most common visitor types.
5. Host Department Distribution
Which departments receive the most visitors? Sales teams may dominate visitor traffic during certain periods, while engineering might spike during product review seasons. This data informs space planning and meeting room allocation.
6. Average Visit Duration
How long do visitors stay? Short visits may indicate quick meetings or deliveries. Extended visits may indicate all-day workshops or contractor engagements. Visitor management analytics on visit duration helps with building occupancy planning and security coverage.
7. Pre-Registration Rate
What percentage of visitors are pre-registered versus walk-in? Higher pre-registration rates correlate with faster check-in times and better visitor experiences. Track this metric to measure the effectiveness of pre-registration adoption campaigns.
8. Check-Out Compliance
What percentage of visitors properly check out? Low check-out rates compromise the accuracy of real-time occupancy data and emergency headcounts. This metric identifies the need for check-out process improvements.
9. Watchlist Hit Rate
How often does the screening system flag a visitor? Track both true positive and false positive rates to calibrate your screening sensitivity and demonstrate security program effectiveness.
10. Repeat Visitor Frequency
How many of your visitors are returning visitors? High repeat rates may indicate opportunities for streamlined check-in workflows or bulk pre-registration for regular visitors. For a deeper understanding of how visitor analytics connect with space utilization, explore our space management software overview.
Dashboard Features for Effective Analytics
Real-Time Occupancy View
The most critical dashboard element is a real-time display of current building occupancy, showing how many visitors are currently checked in, their locations, and their hosts. This view supports emergency preparedness and daily operations.
Historical Trend Charts
Line charts and bar graphs showing visitor volume over time (daily, weekly, monthly, yearly) reveal patterns that single-day snapshots miss. Look for a dashboard that allows custom date ranges and comparison periods.
Heat Maps
Visual heat maps showing visitor traffic by time of day and day of week make it easy to identify peak periods at a glance. Visitor management analytics dashboards with heat maps help facility managers optimize staffing schedules.
Department Breakdown
A breakdown of visitor traffic by host department helps each team understand their visitor footprint. This data is useful for internal space allocation discussions and meeting room booking policies.
Compliance Status Panel
A dedicated compliance panel should show the status of required processes: NDA signing rates, safety induction completion, screening rates, and check-out compliance. Green, yellow, and red indicators provide instant visibility into compliance health.
Export and Reporting
Every dashboard should support data export in standard formats (CSV, PDF) for sharing with stakeholders who do not have dashboard access. Scheduled automated reports (weekly or monthly summaries sent via email) reduce the administrative burden.
Using Analytics for Compliance Reporting
Audit-Ready Reports
When auditors arrive, whether for ISO 27001, SOC 2, HIPAA, or industry-specific certifications, they will ask about visitor management practices. Visitor management analytics should generate audit-ready reports that document screening completion rates and results, NDA signing compliance, visitor access to restricted areas, data retention compliance, and incident logs related to visitor access.
Automated Compliance Monitoring
Rather than preparing for audits retroactively, use analytics to monitor compliance continuously. Set up alerts for compliance metrics that fall below thresholds. If NDA signing rates drop below 100%, the system should notify the responsible team immediately, not six months later during an audit.
Regulatory Report Templates
For organizations subject to specific regulations, look for a system that includes report templates aligned with those requirements. A HIPAA compliance report, for example, should map visitor data handling practices to specific HIPAA provisions.
Turning Visitor Analytics into Business Decisions
Staffing Optimization
Visitor management analytics showing peak visitor hours allow you to align reception and security staffing with actual demand. If 60% of daily visitors arrive between 9:00 and 11:00 AM, staff accordingly rather than maintaining uniform coverage all day.
Space Planning
Visitor volume data by department and meeting room usage patterns inform space planning decisions. If the sales team receives three times more visitors than any other department, their location relative to the lobby and meeting rooms should reflect this.
Security Resource Allocation
Screening hit rates and incident data help security directors allocate resources where they are most needed. If one entrance generates more screening alerts than others, it may warrant additional security presence.
Process Improvement
Check-in time data reveals where the check-in process has friction. If first-time visitors take significantly longer than returning visitors, the initial registration workflow may need simplification. If check-in times spike during certain hours, additional kiosks or staff may be needed.
Budget Justification
For a deeper look at how visitor data supports multi-site management, explore our multi-location visitor management guide. Visitor management analytics provide the data to justify budget requests. “We need a second reception kiosk” is more compelling when supported by data showing that check-in wait times exceed five minutes during peak hours, with 200+ visitors affected per week.
Visitor Management Analytics: Basic vs. Advanced Comparison
| Capability | Basic Reporting | Advanced Visitor Management Analytics |
|---|---|---|
| Visitor count | Daily totals only | Hourly, daily, weekly, monthly with trends |
| Check-in time tracking | Not available | Average, median, and percentile analysis |
| Real-time occupancy | Not available | Live dashboard with zone-level detail |
| Department breakdown | Not available | Full breakdown with historical comparison |
| Compliance reporting | Manual compilation | Automated, audit-ready reports |
| Predictive insights | Not available | Forecasting based on historical patterns |
| Custom reports | Fixed report formats | Fully customizable with filters and date ranges |
| Data export | Limited or none | CSV, PDF, API access |
| Automated alerts | Not available | Threshold-based alerts for key metrics |
| Multi-site comparison | Not available | Cross-location benchmarking |
Getting Started with Visitor Analytics
Step 1: Define Your Questions
Before diving into data, identify the questions you want to answer. Are you trying to optimize staffing? Justify space changes? Prepare for an audit? Improve the visitor experience? Your questions determine which metrics matter most.
Step 2: Ensure Data Quality
Visitor management analytics are only as good as the data behind them. Ensure that all visitors are checking in through the system, that check-out compliance is high, and that visitor categories are assigned correctly. Bad data leads to bad decisions.
Step 3: Establish Baselines
Before you can improve, you need to know where you stand. Run reports for the past 30, 60, and 90 days to establish baseline metrics for visitor volume, check-in times, and compliance rates.
Step 4: Set Goals
Based on your baselines, set specific, measurable goals. Reduce average check-in time from 90 seconds to 45 seconds. Increase pre-registration rate from 30% to 60%. Achieve 100% NDA signing compliance.
Step 5: Review Regularly
For a comprehensive view of how analytics tie into compliance documentation, see our visitor management compliance guide. Schedule monthly analytics reviews with the relevant stakeholders. Share dashboard access with facility managers, security directors, and department heads. Visitor management analytics deliver value only when the people who can act on the insights actually see them.
Frequently Asked Questions
What are visitor management analytics?
Visitor management analytics is the practice of collecting and analyzing data from digital visitor check-in systems to understand visitor traffic patterns, measure operational efficiency, ensure compliance, and support business decisions. The analytics engine processes every check-in event, including arrival time, visitor type, host department, visit duration, and check-out time, to produce dashboards, reports, and insights that help facility managers, security teams, and executives manage their buildings more effectively.
What visitor metrics should I track?
At minimum, track daily visitor volume, peak hours, average check-in time, visitor type distribution, host department breakdown, visit duration, pre-registration rate, check-out compliance, watchlist screening results, and repeat visitor frequency. These 10 metrics provide a comprehensive view of your visitor management operations and support decisions about staffing, space planning, security, and process improvement. More advanced organizations may also track sentiment data, lobby wait times, and cross-site comparisons.
How do visitor analytics help with compliance?
Visitor management analytics generate automated reports that document screening completion rates, NDA signing compliance, access control enforcement, and data retention practices. During regulatory audits for frameworks like ISO 27001, SOC 2, HIPAA, or GDPR, these reports provide the evidence auditors need to verify that visitor management processes meet requirements. Continuous compliance monitoring through analytics also catches issues early, before they become audit findings.
Can visitor analytics predict future visitor volume?
Advanced visitor management analytics systems use historical data to forecast future visitor volume. By analyzing patterns across days of the week, time of year, organizational events, and other factors, the system can predict expected visitor traffic for upcoming periods. These predictions help facility managers plan staffing, prepare for high-volume days, and identify anomalies when actual traffic deviates significantly from predicted patterns.
How long should visitor analytics data be retained?
Data retention periods depend on your organization’s regulatory requirements and internal policies. Most organizations retain visitor analytics data for one to three years, which provides enough history for trend analysis and compliance documentation. Some regulations specify minimum retention periods. For example, GDPR requires that personal data not be kept longer than necessary, while certain healthcare and financial regulations mandate specific retention windows. Configure your system to align with all applicable requirements.
Unlock the Full Value of Your Visitor Data
You are already collecting visitor data every time someone checks into your building. Visitor management analytics turn that raw data into insights that improve operations, strengthen security, and document compliance.
Vizitor’s analytics dashboard provides real-time occupancy, historical trends, compliance reporting, and export capabilities in a single view.
Request a demo to see Vizitor’s analytics in action, or explore the full visitor management system for all features.
Try Vizitor Free
No credit card required. Setup in under 5 minutes. Manage visitors, queues, meeting rooms, and more.
Start Free TrialSee Vizitor in action check-in a visitor in under 30 seconds
Trusted by 500+ businesses. QR check-in, badge printing, NDA signing. Plans from $36/mo.