Why Every Line You Wait In Follows the Same Math
This plain-language guide explains queuing theory, the mathematical study of how lines form and move, covering its origin with Danish engineer Agner Erlang's 1909 telephone-exchange research, the four variables that shape any queue (arrival rate, number of servers, service time, queue discipline), Kendall notation (M/M/1, M/M/c), and Little's Law (L = λW) with two illustrative worked examples. It covers the four classic queue disciplines, the counterintuitive reason wait times spike as utilization approaches capacity, common mistakes when applying the theory in practice, and when a formal model isn't worth using. It closes by connecting the theory to real front-desk queue management, without overstating what any single tool can guarantee.


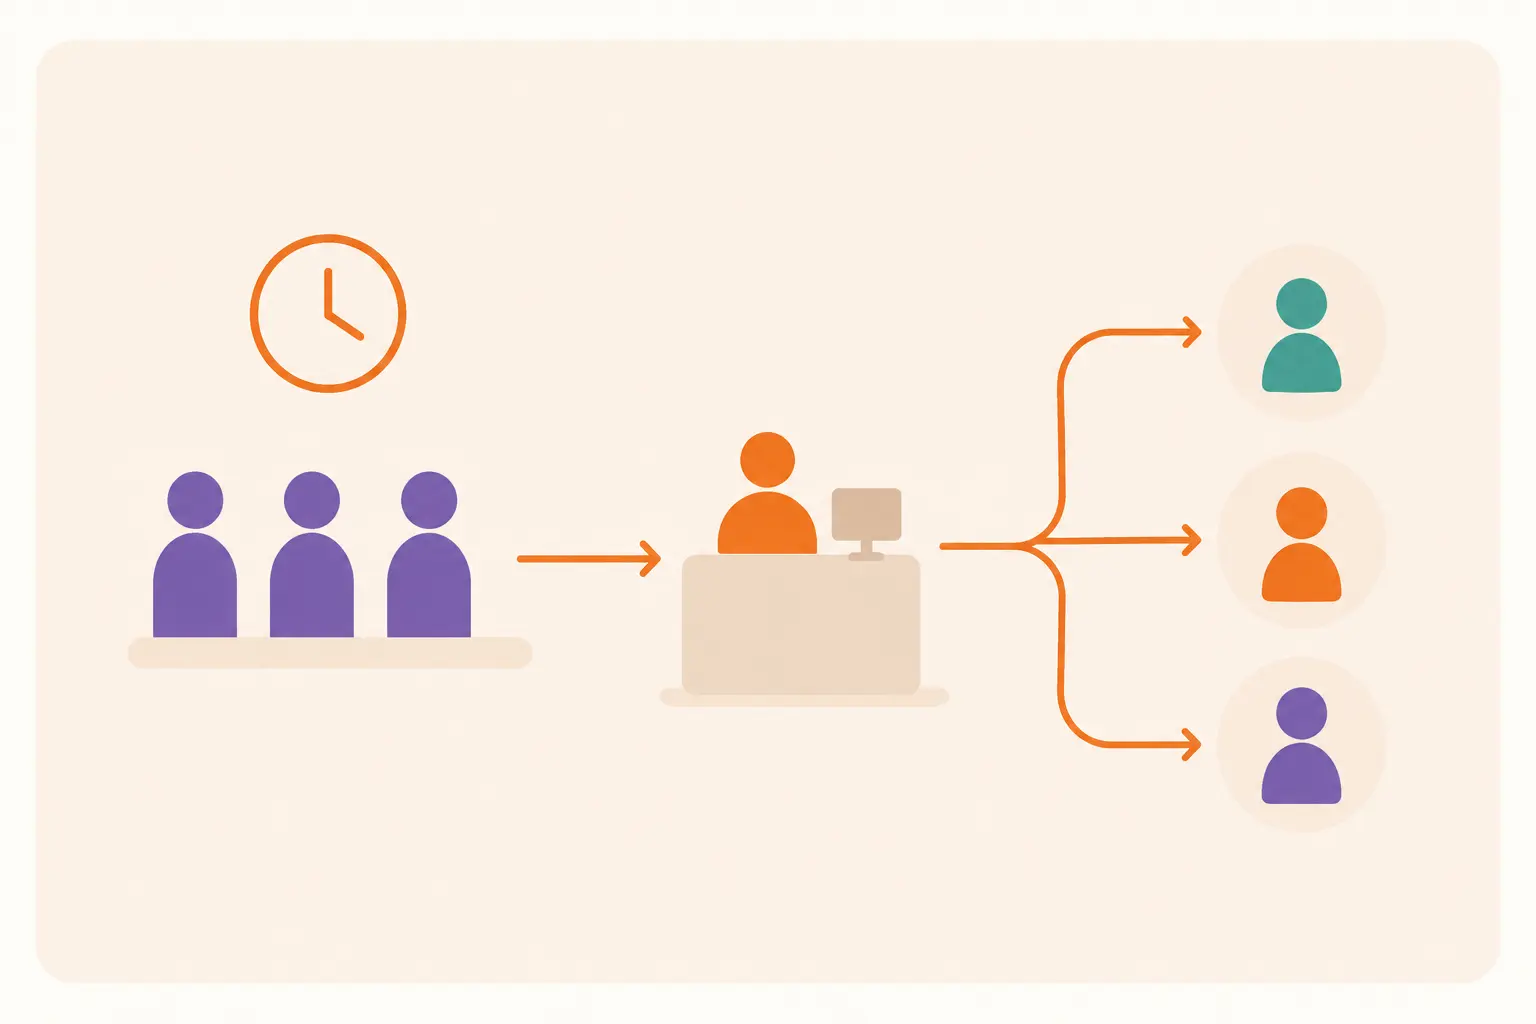
Table of Content
Try Vizitor for Free!
Every line you’ve ever stood in, a bank counter, an airport gate, a coffee shop on a Monday morning, obeys the same handful of rules, first written down over a century ago by a Danish telephone engineer trying to stop calls from dropping. Queuing theory is the mathematical study of how lines form, move, and back up, built around four things: how fast people arrive, how many servers are working, how long each person takes to serve, and what order people get served in. Change any one of those four, and the whole line behaves differently.
This is a plain-language walkthrough of that theory, no differential equations required, aimed at anyone who manages a line for a living rather than anyone studying for an operations research exam. If you run a front desk, a clinic, a retail counter, or any place where people wait, the ideas here explain why your line behaves the way it does, and why some fixes that seem obvious don’t actually help.
A phone engineer’s problem, not a mathematician’s puzzle
Queuing theory didn’t start as pure math. It started as a very specific, very practical complaint: dropped calls. Agner Krarup Erlang, an engineer at the Copenhagen Telephone Exchange, was trying to figure out how many telephone lines and operators a switchboard actually needed so that calls wouldn’t get blocked during busy periods. His first paper on the subject, published in 1909, modeled exactly that problem, and the unit used to measure network traffic load today, the erlang, still carries his name.
The reason this history matters is that it explains what queuing theory is actually for. It’s not an abstract math exercise. It’s a toolkit for answering one operational question: given how many people are showing up and how long they take to serve, how many servers do you actually need, and what happens if you get that number wrong.
The four things that determine any queue
Every queuing system, whether it’s a switchboard, a checkout line, or a hospital waiting room, is shaped by four variables.
Arrival rate. How often new people (or calls, or packages, or support tickets) show up. This is rarely constant; most real queues have peaks and lulls, which matters more than the average arrival rate suggests.
Number of servers. How many people or machines are available to actually process each arrival. One cashier versus four cashiers isn’t just “four times faster,” because of how queuing math compounds, which is covered further down.
Service time. How long it takes to serve one person once they reach the front. Like arrival rate, this varies, not every transaction takes the same amount of time, and that variation matters as much as the average.
Queue discipline. The rule that decides who gets served next. First-in-first-out is the most familiar, but it’s not the only option. Vizitor’s guide to first-in-first-out queuing covers that specific discipline in depth; this article treats it as one option among several, covered below.
Kendall notation: a shorthand for describing a queue
Queuing theory has its own shorthand for describing a system in three characters, written as A/S/c: the arrival pattern, the service pattern, and the number of servers.
The most common starting example is what’s called an M/M/1 queue: random (technically Poisson-distributed) arrivals, random (exponentially distributed) service times, and one server. Picture a single checkout counter where customers arrive unpredictably and each transaction takes a random amount of time. Add more cashiers to that same setup, and it becomes an M/M/c queue, the same randomness, just spread across multiple servers working in parallel.
You don’t need the underlying probability distributions to get the useful part: a one-counter setup and a multi-counter setup with the same total capacity behave very differently under real-world randomness, which is exactly why “we have enough total capacity” doesn’t always translate into “the line moves fine.”
Little’s Law: the one formula worth remembering
If queuing theory has a single idea worth carrying around in your head, it’s Little’s Law, written as L = λW.
L is the average number of people in the system at any moment. Lambda (λ) is the average arrival rate, how many people show up per unit of time. W is the average time each person spends in the system, waiting plus being served.
Here’s why it’s useful without needing to touch a probability textbook: if you know any two of those three numbers, you can calculate the third. A clinic that sees an average of 12 patients an hour (λ) with an average total visit time of 25 minutes (W) will have roughly 5 patients in the building at any given moment (L), whether they’re waiting or being seen. That’s a real, checkable number a facility manager can use to size a waiting room, not an abstract formula.
Here’s a second, illustrative example to show the formula working the other direction. Say a front desk logs an average of 20 visitor check-ins per hour (λ), and a manager notices there are typically about 4 people in the lobby at any given moment (L). Rearranging the formula (W = L ÷ λ) gives an average time-in-system of 12 minutes per visitor. If that number feels too high once it’s actually calculated, that’s the formula doing its job: turning a vague sense of “the lobby feels busy” into a specific number worth investigating. These figures are illustrative only, meant to show the calculation, not a benchmark for what your own front desk should expect.
The classic queue disciplines, beyond first-in-first-out
Deciding who gets served next isn’t always as simple as “whoever arrived first,” and queuing theory names a handful of standard alternatives.
First-in-first-out (FIFO). The default most people picture: earliest arrival, served first. Fair, predictable, and easy for people to understand without an explanation.
Last-in-first-out (LIFO). The most recent arrival gets served first. Rare for people (it feels unfair), but common in other contexts, like a stack of print jobs or the last item placed in a storage system.
Priority queuing. Some arrivals jump ahead based on a rule: an emergency room treating the most critical patient next regardless of arrival order, or a support desk prioritizing a paying customer’s ticket over a free-tier one.
Random selection. Rare in customer-facing settings but used in some technical systems where fairness isn’t the goal and simplicity is.
Most real front desks actually run a hybrid: FIFO within a category, with priority overrides for genuine exceptions. Vizitor’s guide to appointment queue management covers exactly that kind of hybrid routing between scheduled visitors and walk-ins.
The most counterintuitive lesson in queuing theory
Here’s the part that surprises most people managing a real line: wait times don’t grow gradually as a system gets busier, they grow explosively as utilization approaches its limit.
A counter running at 70% of its maximum capacity might have short, manageable waits. Push that same counter to 90% utilization, and average wait time doesn’t rise by roughly the same proportion, it can multiply several times over, because there’s less and less slack in the system to absorb the natural randomness in arrivals and service times. This is why a front desk that looks “almost fine” on a spreadsheet showing average utilization can feel chaotic in practice: averages hide exactly the variability that queuing theory says matters most.
The practical takeaway isn’t “always run under capacity,” which isn’t realistic for a business. It’s understanding that the last 10-15% of capacity costs far more in wait time than the same 10-15% earlier in the range, which is exactly the kind of tradeoff worth knowing before deciding whether to add a server or just live with occasional long waits.
Why perceived wait time isn’t the same problem as actual wait time
Queuing theory models the actual time in the system, arrival to departure. It says nothing about how that wait feels, and the feeling is its own, separate problem. Vizitor’s guide to the psychology of waiting covers why an unexplained wait feels longer than an explained one of the same length, which is a genuinely different question from anything Erlang was solving in 1909. Both matter for a real front desk; they’re just not the same lever.
Where this actually shows up
Queuing theory isn’t confined to telephone exchanges anymore. DMVs and government service counters use it to size staffing against citizen arrival patterns. Airports use it for security lines and gate boarding. Hospitals and clinics use it to plan waiting-room capacity and staff scheduling. Call centers use it directly, the same math Erlang built for dropped calls still determines how many agents a call center needs to keep hold times reasonable. Retail and manufacturing use versions of it for checkout staffing and assembly-line throughput. Logistics companies use it to plan package sorting capacity.
Front desks and reception areas are a smaller-scale version of the exact same problem: people arriving at an uneven rate, a limited number of staff to serve them, service times that vary by visitor type, and a decision about what order to serve people in. Vizitor’s queue management system exists at that intersection, department-wise token routing is a direct, practical answer to the “queue discipline” question above, and real-time queue visibility is a direct answer to the “how many people are actually waiting right now” question Little’s Law is built to estimate.
Common mistakes people make applying this in practice
The first mistake is staffing to the average arrival rate instead of the peak. A front desk sized for average Tuesday traffic will struggle every Monday morning, because queuing math cares about the actual distribution of arrivals, not just the mean.
The second is assuming more servers always helps proportionally. Splitting one queue into several separate lines, each with its own server, usually performs worse than one shared queue feeding multiple servers, because a single queue lets any free server take the next person immediately, while separate lines can leave one server idle while another has a backup.
The third is ignoring service-time variance. Two counters with the same average service time can produce very different wait experiences if one has wildly inconsistent transaction lengths and the other doesn’t. Reducing that variance, not just the average, is often the more effective fix.
The fourth is treating a queuing model as a guarantee rather than an estimate. Real arrivals aren’t perfectly random, real service times aren’t perfectly distributed, and real queues have real people who abandon them, arrive early, or negotiate their way to the front. The math is a planning tool, not a prediction machine.
The fifth is picking a queue discipline without telling anyone what it is. A priority system that isn’t visibly explained looks like favoritism to everyone who didn’t get priority, even when the underlying rule is perfectly reasonable. The discipline matters less than whether people waiting can see and understand it.
When you don’t need any of this
A tiny operation with one or two visitors an hour doesn’t need queuing theory; it needs a chair and a receptionist with a memory. The math starts earning its keep once volume, staffing, or visitor mix gets complex enough that intuition stops being reliable, multiple visitor types, unpredictable peaks, more than a couple of service points, or a real cost attached to long waits. Below that threshold, a simple, clearly communicated policy beats a formal model every time.
The math behind the wait
Queuing theory won’t make a line disappear, but it explains why lines behave the way they do, why adding one more server doesn’t always fix a bad wait, and why the busiest hour of your day deserves more planning attention than the average one. Most of it comes down to four numbers: how fast people arrive, how many servers you have, how long service takes, and who gets served first.
If putting that into an actual working system is the next step, book a demo to see how Vizitor’s queue management system handles routing, service order, and real-time visibility for the queues you’re actually running.
Frequently Asked Questions
See Vizitor in action check-in a visitor in under 30 seconds
Trusted by 500+ businesses. QR check-in, badge printing, NDA signing. Plans from $36/mo.